Numerical Indifference
I was really proud of myself last week when I made what I felt was a valid and illuminating numerical comparison: I wrote that the amount of Broadband Stimulus money requested for projects within the state of Alaska—projects serving rural and underserved communities—was on a per-capita basis about equal to the federal poverty level for a 2-person household. For those of us who work on access and inclusion (and even those that don’t), that’s a much more meaningful statement than writing “about $15,000”.
I have a degree in math, but at the post-calculus level numbers serve little specialized purpose other than to check your work. One of the professors I now work beside, Marilyn Frankenstein, teaches how to make numbers relevant and meaningful by contextualizing them. She does her studies integrating mathematics and numerical literacy into social justice work (I do work within the College of Public and Community Service, after all), which all falls under Radical Math (which is a funny name if you find math funny).
That all being said, you shouldn’t provide a number without a reason. And since you’re providing the number for a reason, that reason should be apparent. If you expect someone to think “That’s a really big number” you should tell them it’s a really big number and help them understand just how big it is. A number without meaning is just data, and data is boring. If you’re giving someone data and expecting it to have meaning you’re making someone else do extra work by analyzing that data and coming to the conclusion you already have: the reason you thought the number was important in the first place.
The problem with numbers is that within the sphere of other numbers, there isn’t any reference points (other than perhaps zero). And there are a lot of numbers. More than you can count (hah!).
The problem with people is that we can only remember 3 or 4 things at a time. This means that we tend to bunch the infinite space of numbers into a very small number of groups: nothing, a little, a bunch, and a whole heck of a lot. The way we group things is not by some property of the number itself, but rather by the context it’s given in. By contextualizing numbers and giving them meaning, you move them from data (boring!) to useable information: it is not the numbers themselves that will stick with us, but the meaning they represent.
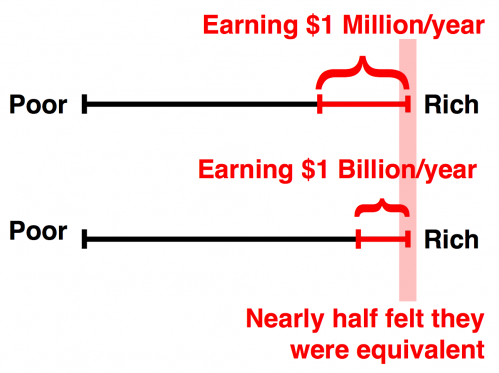
To show this, I made up 2 different surveys and sent them to my friends on Facebook and whoever happens to follow me on Twitter. In the first survey I asked people to place someone who makes $1 Million/year and someone who makes $1 Billion/year on a 10 point scale of Poor to Rich. Nearly all responses placed $1 Million/year between 7 and 10; and placed $1 Billion/year between 8 and 10; both very Rich. Nearly half of the responses placed both incomes as equivalent at a 10: the mostest richest.

I admit that many of my friends are Americorps alums, nonprofitty folks and other liberal ilk, but the point I want to make is that there isn’t a whole lot of difference, within the context of rich and poor, between someone who makes $1 Million/year and someone who makes $1 Billion/year. Myself, I split incomes into about 5 different levels:
-
less than $12k/year: been there, done that
-
$12k - $30k/year: limited fun
-
$30k - $50k/year: the expected earnings potential for my career trajectory
-
$50k-$100k: The job of my dreams and/or did I just go corporate?
-
$100k+: Cloud 9
Now I didn’t ask people specifically about themselves, but there are a few things to notice using myself as an example. There are only a few levels (I condensed 100,000 whole numbers into just 4 groups, plus a 5th group for everything else) and there are more groups for smaller numbers than there are for larger numbers (it’s logarithmic-ish: the group sizes are 12, 18, 20, 50, infinity). Also, the numbers are in relation to what I know: what I’m making right now is in the middle and there are 2 groups above and 2 groups below.
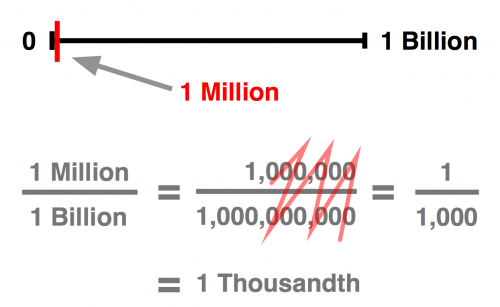
So on to the 2nd survey: I asked people where the number 1 Million would fall on a number line between 0 and 1 Billion. This is actually a pretty typical “aha!” classroom example and a good number of people got it right (many of my friends are also nerds). What’s interesting is the 25% percent of people (1 out of 4) who got it wrong; they chose 3, 5 or 7: exactly where you would divide a 10 point scale into quarters or maybe a few did it by thirds. That’s the expected thing to do if you don’t know this particular trick (and is also a good strategy in Trivial Pursuit).
So what’s the answer? On a 10 point scale, the answer is actually zero, but since that wasn’t an option in my survey, the most correct answer was 1.

The number 1 Billion is 1,000 times larger than the number 1 Million: and 1,000 still is a big number (hilariously, large numbers are made up of many zeros). Compared to 1 Billion, the number 1 Million is rather pale and insignificant….
…unless you’re talking about something meaningful like someone’s salary. In which case, they’re very much the same.
And if you place them in terms of money that’s been wasted through fraud, for example, then the differences should be made apparent because as I’ve shown adding a bunch of zeros just won’t do it on their own.
When numbers are placed in context to things we know and have experience with, they take on actual meaning. This is from the Pew Research Center’s Excellence in Journalism Project’s Principles of Journalism:
- IT MUST STRIVE TO MAKE THE SIGNIFICANT INTERESTING AND RELEVANT
Journalism is storytelling with a purpose. It should do more than gather an audience or catalogue the important. For its own survival, it must balance what readers know they want with what they cannot anticipate but need. In short, it must strive to make the significant interesting and relevant. The effectiveness of a piece of journalism is measured both by how much a work engages its audience and enlightens it. This means journalists must continually ask what information has most value to citizens and in what form. While journalism should reach beyond such topics as government and public safety, a journalism overwhelmed by trivia and false significance ultimately engenders a trivial society.
I’m not saying we all should strive to be journalists, but I think we should strive to make the significant interesting and relevant. To be fair, false significance can be a powerful rhetorical device when it comes to numbers: just watch your evening news the next time they breathlessly “break” a story about public employees making “gasp!” $60k/year. “How dare they make twice the local average income level?!” …because that’s how averages work.
Another example: in my last post about doing the layout for Survival News (“the voices of low income women”), I noted that if the newspapers in circulation were spread out, they would completely cover the John Hancock Building in Boston up to its 20th floor. That’s much more fun and meaningful than only writing “4,000 copies” (the building has already been covered with plywood, so why not?).
And now to the entire reason I wrote this post: I would like to point out that at 40 tabloid-sized pages, the latest edition of Survival News has 52 square feet of copy and graphics: that’s about the same surface area as your refrigerator.