A difference of a map

From “Assessment Overview of One Laptop per Child Projects”, an evaluation of One Laptop Per Child deployments: “Figure 1 : The current global distribution of XO laptops across the world.”
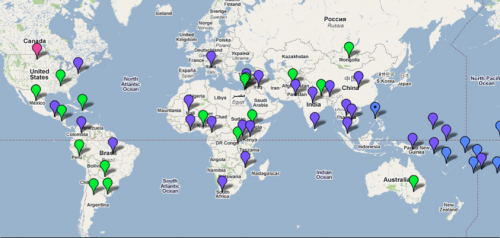
From the community created and curated http://olpcmap.net :
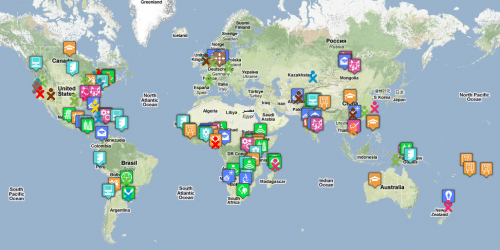
This second map was launched at OLPC San Francisco Community Summit. Marina Zd collected some good pictures of the other maps being created there:

I was invited to attend the summit because of my experience in organizing community events like the Grassroots Uses of Technology Conference. Bottoms-up, participatory and community-centric planning is not a core competency of OLPC (to put it gently), and I was asked to advise on how to better recognize, support and grow the existing—but poorly-connected—communities that are part of the broader OLPC ecosystem. This meant more prosaic things like making sure every session has a volunteer notetaker, but then that’s the kind of thing that helps build a participatory community. Just look at everyone who has added themselves to the map.

But not to  rip on that report either, since it verifies a lot of anecdotes about the impact of OLPC deployments:

Teachers in Ethiopia praised the ease in which they were able to adapt the XO to their existing curricula and its complimentary nature to their lesson plans. They noted that the introduction of the XO forced them to outline a daily schedule and their class objectives each morning, facilitating more effective planning and a more productive day in school. Teachers in the Solomon Islands repeatedly mention how the XO helps them to record children’s activities, monitor their progress, and track their assignments. In Haiti, most teachers noted in their interviews that it was much easier to edit their students’ work on the XO laptop and as such they were able to spend more time working one-on-one with students and less time lecturing.

….

Increased specialized attention, motivation and enthusiasm for learning, and confidence in children’s futures as a result of skills and knowledge building are huge components in building child confidence and drastically improving attendance, thereby decreasing dropout rates in the long-run, and producing a more well-educated society. Similar overwhelmingly positive statements about child confidence and the feelings of being “special” and worthwhile as a result of the introduction of laptops into the community for the children are found in reports from Alabama in the United States all the way to remote indigenous communities in Western Australia.

Metaphors and diversity

Interactions between people with diverse backgrounds leads to richer and more effective experiences.

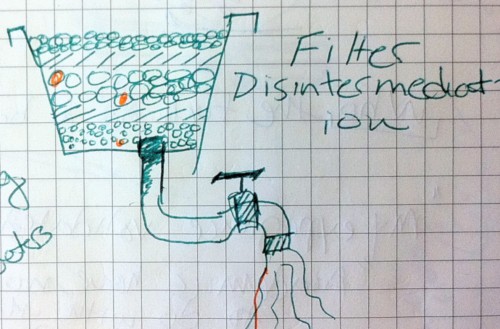
About two months ago I attended the 140 Character Conference in Boston. Mostly it was a bunch of white guys using phrases like “filter disintermediation”. Fortunately there was a woman who described the need to “midwife” a process, and a crazy old guy (that is what I wrote in my notebook—though he probably made the most sense) who described the educational system as “constipated”. They were the highlights—and pretty much all I remember too.


Learning styles and chemistry

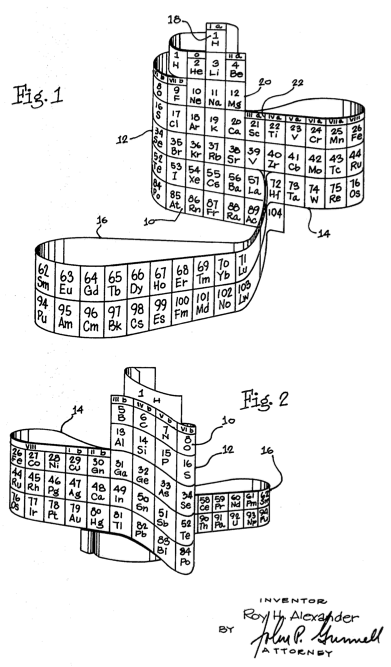
Roy Alexander, creator of the 3-D Periodic Table, recently commented on my blog since I had posted previously about his unique construction. Below is from his “The Argument for 3-D Periodic Table” (emphasis original):

The theory of multiple intelligences has grabbed the attention of many educators around the country, and hundreds of schools are currently using its philosophy to apply to the various student learning styles.

Students generally fall into more than one of Gardner’s multiple intelligences. Those other than word-, number-, and reasoning-smart may deliberately avoid or fail at the ordinary academics. Teachers, most of them of the above intelligences, may have difficulty perceiving the needs of the others. It is important to address all the students, in Chemistry as in other school subjects.

All students have some of all the intelligences, most leaning more toward one or several. A 3-D model of the periodic table touches on some of the intelligences often ignored, as well as addressing students capable of critical thinking. The periodic table is introduced at the beginning of chemistry, and so is of great importance.

The construction of the 3-D model, an interactive and kinesthetic activity, has the student physically handle specific segments of the table, and deliberately place them in their correct locations relative to all the other parts, helping them to learn the names of the segments and see how obvious and logical the periods are.

The naturalist in students can identify the dimensionality of the periodic table with all other parts of nature - which are all also three dimensional. This association removes the table from the purely abstract to represent, as it informationally does, all of reality.

In a classroom session, the common experience of all to make their own periodic table (and to have it for themselves - perhaps to show to parents, siblings, etc. …and have to then explain something about it) provides, initially, an interpersonal experience with classmates, and then a sense (and reality) of ownership. The flat tables will always be there for quick and easy reference, but the foundation for that table, will be solid - literally.

The pictured 3-D models used in the introduction to chemistry, promote quick and easy familiarity with the periodic table for the new student.

Students characterized by the first of Gardner’s three intelligences; “ Linguistic (“word smart”), Logical-mathematical (“number/reasoning smart”), and Spatial intelligence (“picture smart”), can have the speed and clarity of their understanding of the flat table in universal use enhanced by enlisting other parts of their own intelligences.


Life before the chart

Humboldt's Isotherms

From Patricia Fara’s Science: A Four Thousand Year History:

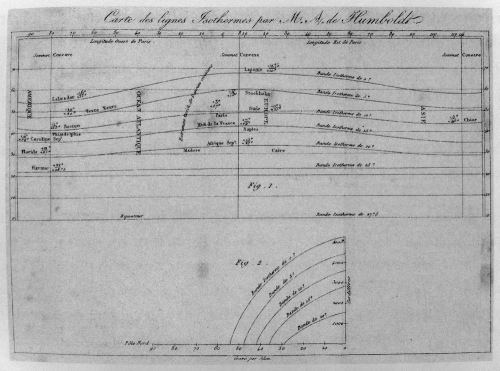
Armed with impressive arrays of accurate instruments, [Alexander von] Humboldt demonstrated that accumulating meticulous measurements could reveal patterns in nature’s vagaries, and so impose mathematical order on variable phenomena such as air pressure, magnetism, and plant distribution. Figure 33 [above] shows his visual argument that there must be general laws describing how temperature varies across the Earth’s surface. Humboldt’s chart stretches from the east coast of America on the left over to Asia on the right, and it illustrates a new and crucially important statistical approach to nature. Instead of plotting actual temperatures on any particular day, Humboldt calculated the annual mean temperature for each place, thus amalgamating many thousands of observations into a few curved lines, called isotherms. By averaging out fluctuations, Humboldt ordained and displayed global regularity.

Humboldt was a visual innovator. Although it now seems obvious that diagrams enable scientists, advertisers, and politicians to summarize evidence and present it persuasively (if not always fairly), Figure 33 is an extremely early example. In the first half of the nineteenth century, graphs, bar charts, and so forth were only just being introduced, and they were slow to catch on. Scientists trying to interpret diagrammatic data had to learn a new visual language—just like reading, deciphering graphs and maps only becomes automatic with practice. Even contour lines, which directly represent actual mountain heights, seemed alien and were not routinely used until the early twentieth century. Humboldt’s isotherms involved yet a further conceptual leap, because they were idealized summaries with no physical reality. By recording averages as lines, Humboldt made statistical regularities visible, short-circuiting masses of detailed numerical readings to present scientific relationships at a glance.

This impetus to think and understand through diagrams was encouraged by new printing techniques, which made it possible to reproduce images cheaply and also to incorporate them within the text rather than binding in separate sheets of paper. Gradually, ingenious visualizing techniques became important in many scientific disciplines. Faraday, for example, knew little mathematics but was an inspired three-dimensional visualizer who developed the concept of electromagnetic fields by imagining lines of force extending out through space with a quasi-real existence. Geology’s great visual innovator was Darwin’s friend Charles Lyell, who included an increasing number of diagrams in successive volumes of his hugely influential Principles of Geology (1830–3). As geologists learnt how to interpret schematic cross sections down through the Earth’s crust, they gradually acquired the skill of automatically translating the vertical scale into vast expanses of time.


Professional writing sample

I quote a lot on this blog from other places, so I wanted to post something I’ve written. I’m Program Director of the Transmission Project’s Digital Arts Service Corps: we recruit and place yearlong, full-time, stipended volunteers in support of capacity-building projects at nonprofit organizations that use media and technology to strengthen communities. We’ve placed more than 400 Corps members at 170 organizations in 30 states. We’re kind’ve awesome.

This briefing is from last Spring, in response to a key government stakeholder asking us to justify our continued relevance after 10 years in the field:

The Transmission Project (before, the CTC VISTA Project) has focused on the Digital Divide in America since its inception. Although this divide continues to exist, its nature has become more complex. No longer are we just concerned about an individual’s access to a computer; other factors such as broadband adoption and the digital participation gap can now have direct impact on a person’s ability to change their socioeconomic status. Enabling individuals and communities to emerge from poverty today relies even more upon their ability to participate in the production and sharing of information through media and technology.

The role information, media and technology play in economic development is well-recognized within government programs. The Federal Communication Commission (FCC) project on the Future of Media and the Information Needs of Communities identifies both “the role of public and other noncommercial media in serving the information needs of the underserved, including language minorities, ethnic minorities, children, the disabled, and the economically disadvantaged” and “the infrastructure needs and assets of public and other noncommercial media in delivering information to communities” as areas for development.

Supporting media and technology is a key activity of social and economic development. Grantmakers in Film + Electronic Media’s (GFEM) newly released report “Funding Media, Strengthening Democracy: Grantmaking for the 21st Century” pushes for acknowledgement of the prevalence and impact of media: “Foundations and government agencies of all sizes and in all fields will benefit from recognizing the growing importance of media to the future of every field—education, health, the environment, and more.”

Recent economic stimulus measures recognize the economic benefits of investment in communications programs and infrastructure. The American Recovery and Reinvestment Act’s Broadband Technologies Opportunities Program, (BTOP) seeks to “expand broadband access to unserved and underserved communities across the U.S., increase jobs, spur investments in technology and infrastructure, and provide long-term economic benefits.” BTOP funded programs and organizations are a priority area for the Transmission Project in our 2010-2011 program year.

The FCC’s National Broadband Plan goes so far as to recommend a new Corporation for National and Community Service (CNCS) initiative, a Digital Literacy Corps, which would “help people get connected—not only to broadband—but to the educational and economic resources that broadband can bring to the next generation of Americans.” Such an initiative would mirror the impact of capacity building and organizational development the Transmission Project has supported over its 10 year history.

But broadband should not be the only focus of development. The FCC also encourages “innovative uses of social media, gaming, Internet applications, citizen journalism, mobile technologies, and other technological and organizational innovations and the possibilities for new kinds of noncommercial media networks” as solutions to the information needs of communities—areas in which the Transmission Project has long-focused.

Capacity building in media organizations takes on a variety of roles. The report “Fighting Poverty: Utilizing Community Media in a Digital Age” includes the World Congress on Communication for Development recommendation that development institutions should provide assistance to build the capacity of community media through training, strengthening of networks and sector associations, technical assistance and investment in order to result in community media’s contribution to long term social change.

The capacity-building needs of media organizations echo the needs identified by the CNCS’s own stakeholder dialogues on capacity building in nonprofits: “The most critical capacity building issues facing small and midsize nonprofits right now are sustainability (cash flow and consistent funding, particularly for infrastructure), leadership, ability to nurture partnerships and relationships, capacity to manage and retain volunteers, weak understanding of the role of governance, short-term thinking and stagnation, capacity to use technology, and capacity to manage and cultivate human capital, both paid and volunteer.”

The Transmission Project, with the support of CNCS, has long recognized the need for capacity building within organizations that use media and technology and the positive impact those organizations and their initiatives can have upon individuals and communities in poverty. The information needs of communities, and the role public media and technology has in meeting those needs, are ever more relevant and necessary today as they were 10 years ago.

There are a few turns of phrase that make me cringe—not to mention reliance on the comma—but overall I am very proud of this writing. It was a quick, 2-day turnaround project that relied heavily upon recent reports and studies we had previously quoted on the Transmission Project’s blog. We never received a formal response, so I assume it was effective.


A deucedly outrag* wordlist

NPR has a story on an algorithm created by researchers David Larcker and Anastasia Zakolyukina that can allegedly detect when business leaders are being dishonest about their company’s practices or earnings. Unfortunately, they don’t publish the complete wordlists used in their algorithm (pdf) , just these 2 categories:

Extreme positive emotions

** amaz*, A-one, astonish*, awe-inspiring, awesome, awful, bang-up, best, bless*, brillian*, by all odds, careful*, challeng*, cherish*, confidence, confident, confidently, convinc*, crack, cracking, dandy, deadly, definite, definitely, delectabl*, delicious*, deligh*, deucedly, devilishly, dynam*, eager*, emphatically, enormous, excel*, excit*, exult, fab, fabulous*, fantastic*, first-rate, flawless*, genuinely, glori*, gorgeous*, grand, grande*, gratef*, great, groovy, hero*, huge, illustrious, immense, in spades, in truth, incredibl*, insanely, inviolable, keen*, luck, lucked, lucki*, lucks, lucky, luscious, madly, magnific*, marvellous, marvelous, neat*, nifty, outstanding, peachy, perfect*, phenomenal, potent, privileg*, rattling, redoubtable, rejoice, scrumptious*, secur*, sincer*, slap-up, smashing, solid, splend*, strong*, substantial, succeed*, success*, super, superb, superior*, suprem*, swell, terrific*, thankf*, tiptop, topnotch, treasur*, tremendous, triumph*, truly, truth*, unassailable, unbelievable, unquestionably, vast, wonderf*, wondrous, wow*, yay, yays, very good

Extreme Negative Emotions

abominable, abortive, absurd, advers*, ambitious, annihilating, annihilative, atrocious, awful, badly, baffling, barbarous, bias, breach, brokenhearted, brutal*, calamitous, careless*, catchy, challenging, cockeyed, coerce, crafty, craz*, cruel*, crushed, cunning, curious, danger*, daunting, daze*, defect*, degrad*, demanding, demeaning, depress*, derisory, despair*, desperat*, despicable, destroy*, devastat*, devil*, difficult*, dire, direful, disastrous, disgraceful, dodgy, dread*, exasperating, exorbitant, extortionate, fail*, farcical, farfetched, fatal*, fateful, fault*, fearful*, fearsome, fierce, finished, fright*, frustrat*, funny, grave*, griev*, guileful, hard, harebrained, harm, harmed, harmful*, harming, harms, heartbreak*, heartbroke*, heartless*, heartrending, heartsick, hideous, hopeless*, horr*, humbling, humiliat*, hurt*, idiot, idiotic, ignominious, ignor*, implausible, impossible, improbable, inauspicious, inconceivable, inferior* , infuriating, inglorious, insane, insecur*, intimidat*, jerk, jerked, jerks, kayoed, knavish, knocked out, knotty, KOd out, KO’d out, laughable, life-threatening, luckless*, ludicrous*, maddening, madder, maddest, maniac*, menace, mess, messy, miser*, misfortunate, mortifying, muddle, nast*, nonsensical, outrag*, overwhelm*, painf*, panic*, paranoi*, pathetic*, peculiar*, pessimis*, pickle, piti*, precarious, preconception, prejudic*, preposterous, pressur*, problem*, reek*, resent*, ridicul*, roughshod, ruin*, savage*, scandalous, scourge, serious, seriously, severe*, shake*, shaki*, shaky, shame*, shock*, silly, skeptic*, slimy, slippery, squeeze, steep, strange, stunned, stupefied, stupid*, suffer, suffered, sufferer*, suffering, suffers, sunk, terribl*, terrified, terrifies, terrify, terrifying, terror*, threat*, thwarting, ticked, tough*, tragic* , transgress, trauma*, tremendous, trick*, trigger-happy, ugl*, unbelievable, unconscionable, unconvincing, unimaginable, unimportant, unlucky, unmanageable, unspeakable, unsuccessful*, untoward, unworthy, usurious, vehement, vexing, vicious*, victim*, vile, violat*, violent*, vulnerab*, washed-up, wicked*, withering, wonky, worst, worthless* , wretched, very bad


No wonder you weren’t good at it

From the introduction to Paul Lockhart’s A Mathematician’s Lament (PDF;  it’s also published as a book which is how I discovered it):

A musician wakes from a terrible nightmare. In his dream he finds himself in a society where music education has been made mandatory. “We are helping our students become more competitive in an increasingly sound-filled world.” Educators, school systems, and the state are put in charge of this vital project. Studies are commissioned, committees are formed, and decisions are made— all without the advice or participation of a single working musician or composer.

Since musicians are known to set down their ideas in the form of sheet music, these curious black dots and lines must constitute the “language of music.” It is imperative that students become fluent in this language if they are to attain any degree of musical competence; indeed, it would be ludicrous to expect a child to sing a song or play an instrument without having a thorough grounding in music notation and theory. Playing and listening to music, let alone composing an original piece, are considered very advanced topics and are generally put off until college, and more often graduate school.

As for the primary and secondary schools, their mission is to train students to use this language— to jiggle symbols around according to a fixed set of rules: “Music class is where we take out our staff paper, our teacher puts some notes on the board, and we copy them or transpose them into a different key. We have to make sure to get the clefs and key signatures right, and our teacher is very picky about making sure we fill in our quarter-notes completely. One time we had a chromatic scale problem and I did it right, but the teacher gave me no credit because I had the stems pointing the wrong way.”

In their wisdom, educators soon realize that even very young children can be given this kind of musical instruction. In fact it is considered quite shameful if one’s third-grader hasn’t completely memorized his circle of fifths. “I’ll have to get my son a music tutor. He simply won’t apply himself to his music homework. He says it’s boring. He just sits there staring out the window, humming tunes to himself and making up silly songs.”

In the higher grades the pressure is really on. After all, the students must be prepared for the standardized tests and college admissions exams. Students must take courses in Scales and Modes, Meter, Harmony, and Counterpoint. “It’s a lot for them to learn, but later in college when they finally get to hear all this stuff, they’ll really appreciate all the work they did in high school.” Of course, not many students actually go on to concentrate in music, so only a few will ever get to hear the sounds that the black dots represent. Nevertheless, it is important that every member of society be able to recognize a modulation or a fugal passage, regardless of the fact that they will never hear one. “To tell you the truth, most students just aren’t very good at music. They are bored in class, their skills are terrible, and their homework is barely legible. Most of them couldn’t care less about how important music is in today’s world; they just want to take the minimum number of music courses and be done with it. I guess there are just music people and non-music people. I had this one kid, though, man was she sensational! Her sheets were impeccable— every note in the right place, perfect calligraphy, sharps, flats, just beautiful. She’s going to make one hell of a musician someday.”

Waking up in a cold sweat, the musician realizes, gratefully, that it was all just a crazy dream. “Of course!” he reassures himself, “No society would ever reduce such a beautiful and meaningful art form to something so mindless and trivial; no culture could be so cruel to its children as to deprive them of such a natural, satisfying means of human expression. How absurd!”

When I tell people I have a degree in math, the response is usually “I was really bad at math.” The truth is that most people never did any actual math; even I did fairly little.


Fairly fool-proof whole-wheat popovers

If your popover fails, it still makes a delicious hockey puck. I also love popovers because they are relatively quick to throw together (about an hour to mix and bake), use 4 basic ingredients (milk, butter, flour, eggs), and are mostly healthy: they won’t induce the same carb coma as pancakes and have fairly little butter baked in (so you can spread a lot on top).

I have made both a ton of popovers and a ton of hockey pucks, so this is my fairly fool-proof method for making the former, not the latter.

Ingredients

1 cup whole wheat pastry flour (or 3/4 C white whole wheat flour + 1/4 C All Purpose White Flour; I have not managed to get consistent results with 100% white whole wheat)

1/4 teaspoon salt

2 eggs (room temperature)

1 cup milk (room temperature)

1 tablespoon melted butter, + more for greasing

Steps

Preheat oven to 400 degrees.

If you forget to set out the eggs and milk, do this: put the milk and eggs in a pyrex measuring bowl in the oven while the oven preheats; be sure to check it after ~5 minutes (you just want to bring it to room temperature or a little warmer; if it gets too hot, when you mix in the flour the starch will get activated and it’ll be gross).

Put a muffin tin in the oven while preheating (you want it hot). Some people also brown a little bit of butter in the bottom of each well (this recipe makes 8 popovers if you’re using a normal-sized muffin tin). I don’t usually do this—I just rub a stick of butter around after the tin is preheated (about 5 min)

Whisk the eggs, milk and melted butter. All the recipes I’ve read warn of overmixing: get a little air in, but no need to beat for more than 30 seconds or so.

Add the flour and salt and whisk about 15 seconds longer. You should see a bunch of little air bubbles.

Take the preheated muffin cups out of the oven; if you browned the butter in the oven, give it a swirl to grease up the sides; otherwise grease it up with a stick of butter. Fill each well in the tin about 1/2 to 3/4 of the way full (I’m able to get 8 of them out of this recipe).

Bake at 400 degrees for 15 minutes (don’t open the oven!), then turn down to 350 degrees (still don’t open the oven!) and bake 25 minutes more. Open the oven (finally!), poke a quick hole in the top of each with a knife, and let them bake about 5 minutes more.

Take them out of the oven and eat.

Key takeaways:

  • You need room-temperature ingredients

  • Pre-heat the muffin tin

  • Have a hot oven

  • Don’t open the oven until the very end. This sucks because if the popovers fail, they fail in the first 10 minutes of baking; but you won’t find out till 30 minutes later (if you open the door mid-bake, they might fall, which isn’t as bad, but not quite as impressive).