Notes from Priceonomics Information Marketing Workshop
These are my notes from attending a full-day in-person Priceonomics Bootcamp; they now have an online Priceonomics Content Marketing Bootcamp. Most of this is covered in their The Content Marketing Handbook or on their blog and operationalized through their Content Tracker. It’s fantastic.
The Priceonomics Story:
- What they were doing at the time: had a business pricing stuff
- Context at the time: OkCupid data blog was good
- Tried to emulate what was going on: “We were better at writing about the business’s data than the doing the business.”
- Found success and evolved: people liked it
Information Marketing
“Data content that spreads”
Key questions:
- What is interesting data that is a byproduct of your business?
- What do you know that’s valuable to other people
“You don’t necessarily need to do information marketing, that’s just what Priceonomics does”
Alternatives to information marketing:
- Story <- Wealthsimple does this
- Info <- Artsy does this
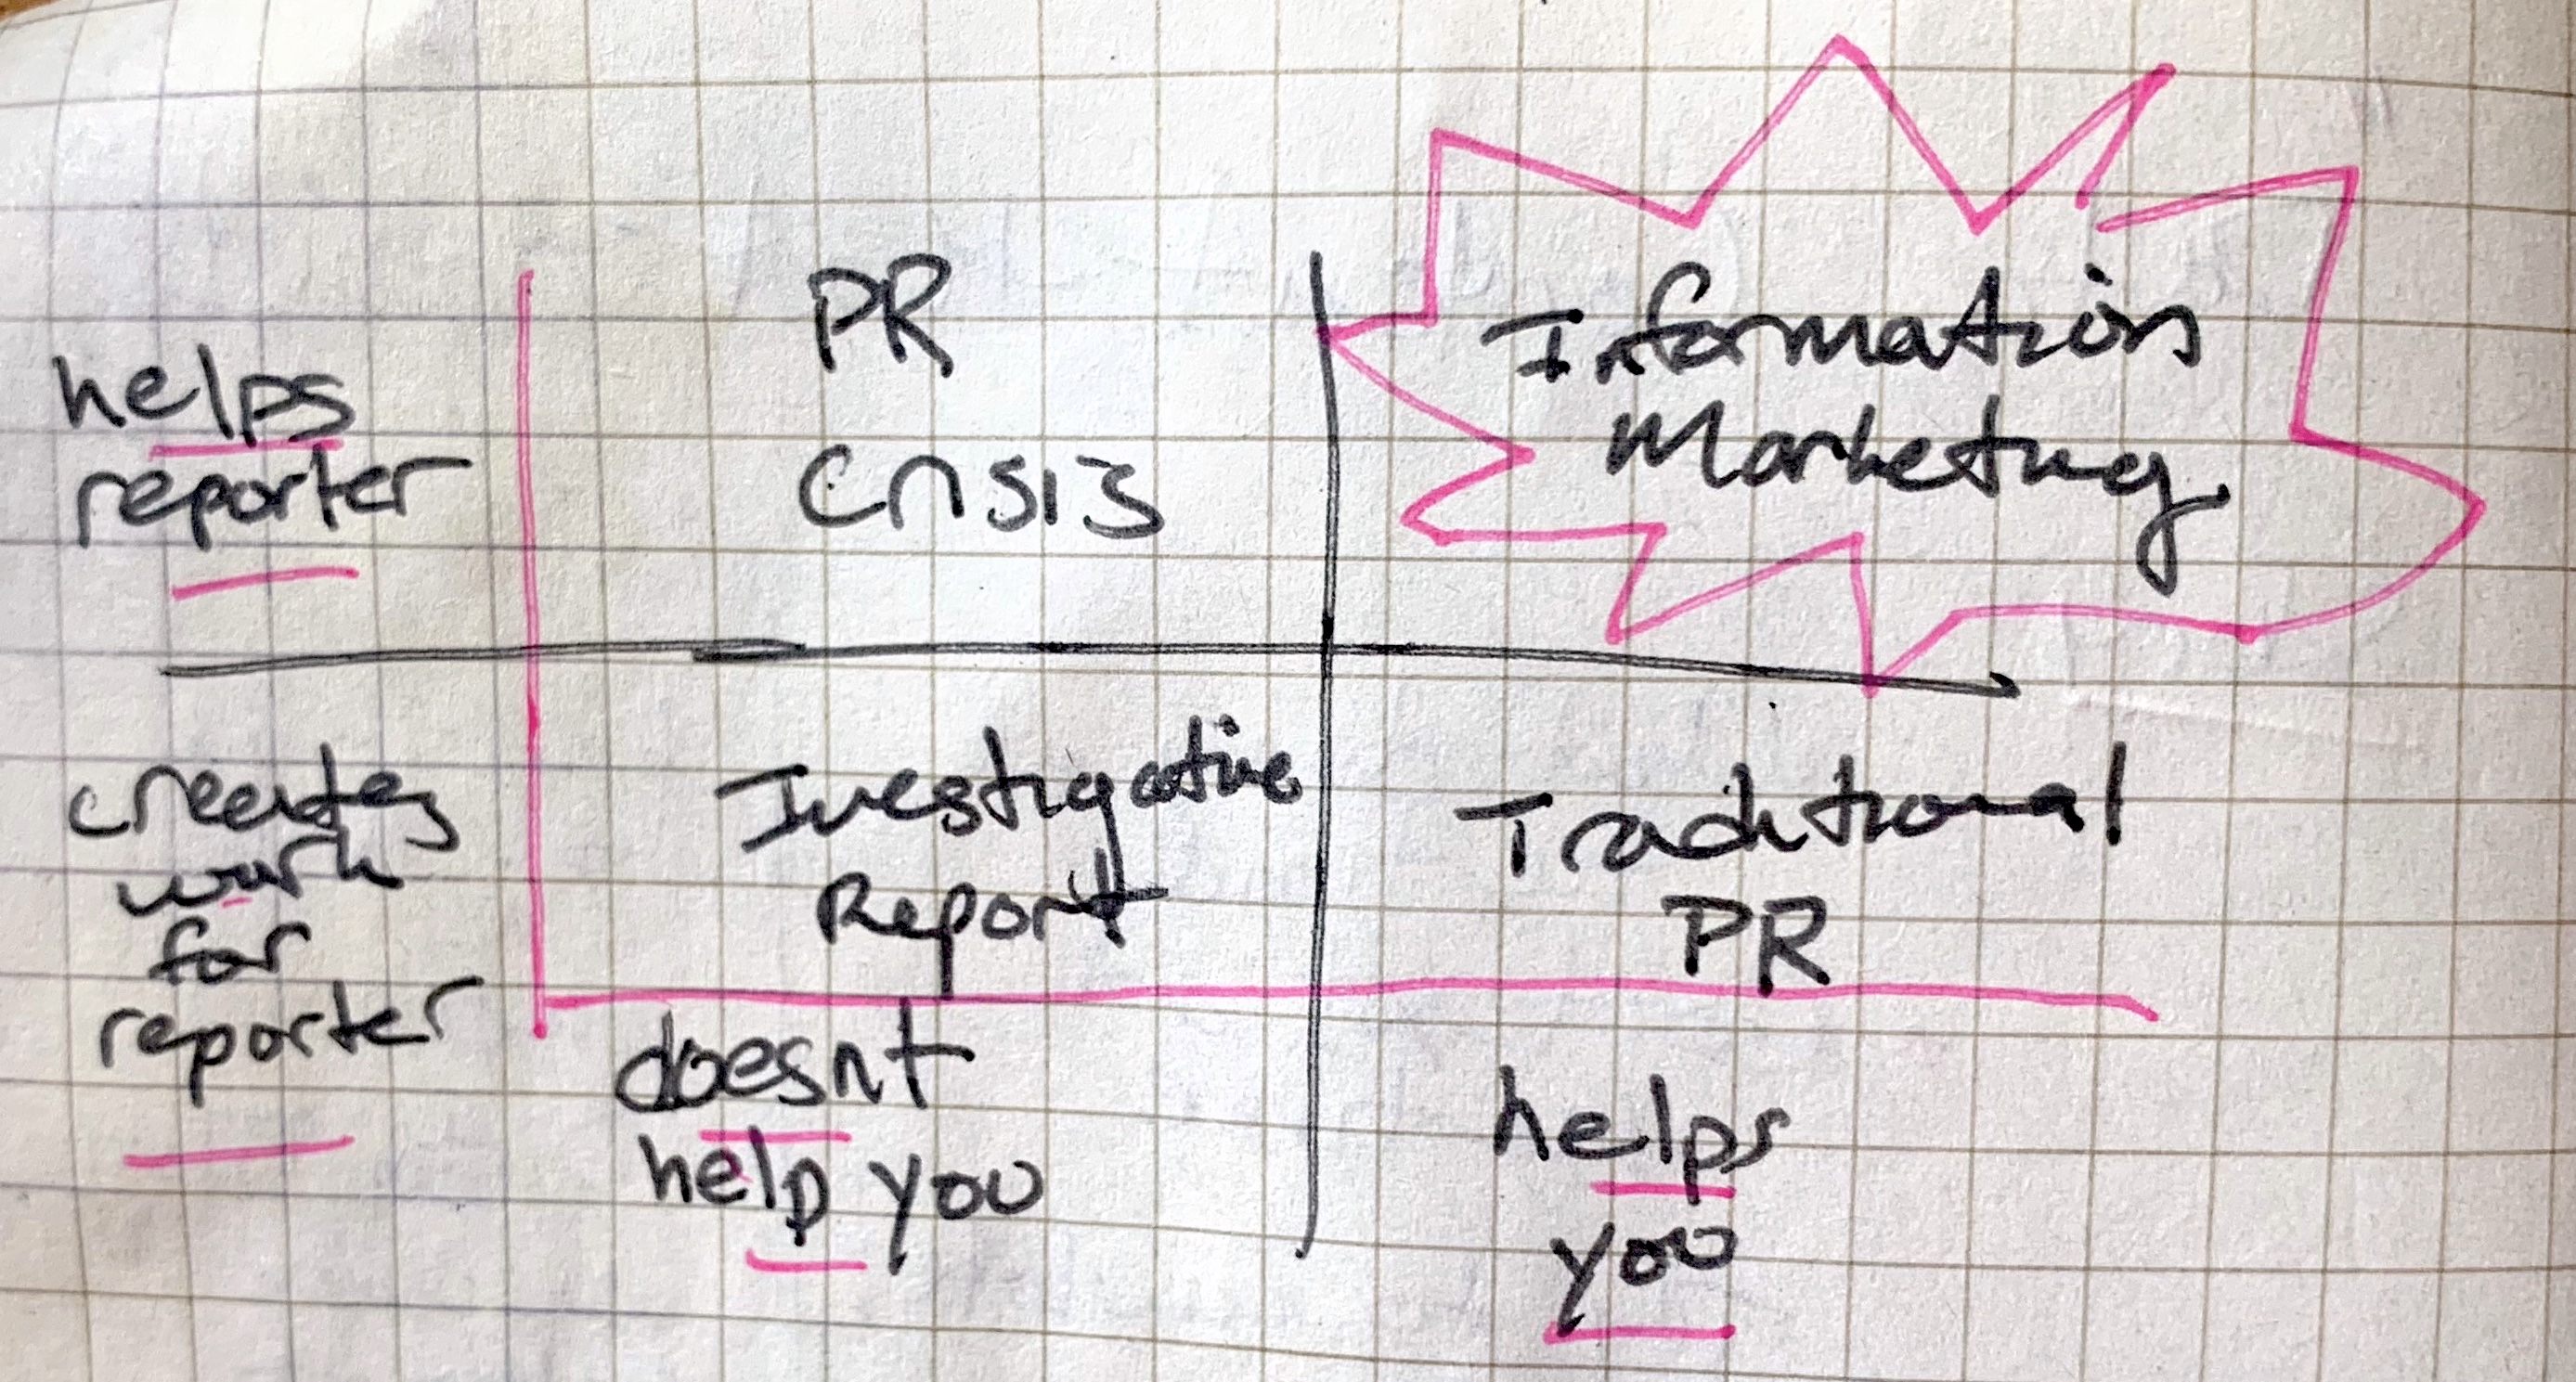
Information Marketing helps reporters AND helps you.
Two Information Marketing strategies:
- Create content that is popular that leads to press hits that leads to inbound
- Do not-massively popular content that converts highly
“Have a clear idea, have a clear distribution plan, and it will work. It’s simpler than you think, but simultaneously easy to screw up.”
Information Marketing overcomes a common challenge: When you publish stories/info about your industry, what do you do with it because it doesn’t fit a media narrative of something to write about… that’s why data posts are easier to share.
Writers Playbook:
- “The Nugget”: What will someone say about this? can they verbalize it? how would they explain it to a friend. Why will someone share this? What will they say about it?
- Maximize “shots on goal” by having something relevant to as many people as possible.
- Top 100 List is better than a Top 10. More people can identify with something you have to say.
- Giving a ranking gives people something to say, e.g. “my thing is 7th”.
- Write clearly, people only read topic sentences. You can’t say anything important in the middle of a paragraph.
- Title should get the point across, and not sound like the article will be boring. “You don’t have the credibility of the New Yorker to have an artsy or vague title”. Signal it’s quantitative and imply “there will be a ranking”. lendedu has good titles.
- Don’t spend time on trying to explain “why”, just show the data. 3-5 charts, 800-1,000 words
-
- A/B Testing Titles: Buy facebook ads with different titles and test clicks. For example “Unfortunate physics of mail urination” vs “Why can’t we design a splash proof toilet?”
- People tend to link to data-driven studies because it’s hard to summarize.
- The holy rail is having a report you update once a year or quarter. Example: Thumbtack small business confidence.
The Process:
Spend 40 hours on pulling together the data. Priceonomics takes 3 week for a full turnaround.
- Prep -> 1 hour. People already have the ideas, they just need to be scoped down and picked for ones that fit a template. Don’t start with a story, just get the data!
- Get the data -> 1 week
- Analyze the data -> 2 weeks
- Write -> 1 week
- Iterations -> 1 week
- Finishing touches -> 1-2 days
Distribution
- Nothing happens until a critical mass of people see it.
- Anticipate where your content will be popular before you start writing. Supernodes: Hacker News, Reddit, Digg, Metafilter, Product Hunt, Next Draft, MediaRedef. Find niche supernodes for your vertical.
- THE BUMP. 1000 simultaneous people. leads to it being organically shared.
- Journalists are the only channel you control.
- Make a list of 50 journalists who would be interested in your data
- Craft your pitch to them in a short email draft (don’t send it). Write the journalist email draft before you write your article
- Start writing your article
- Send the journalist a short, individualized message
- It takes just one
- You’re the information provider It’s not news until an outlet covers you.
- How to do it:
- Make list of 50 journalists who’d be interested in your article.
- Craft your pitch to them in a short email
- Start writing your article
- Then send them a short individualized email.
- It takes just one. Keep a list of everyone who has ever written about you. Send them a quick thanks.
Subject: Buying data shows people purchase t-shirts when they wake up
Hi Sam,I read your article about shirts.io last year
Just wanted to let you know Day of the Shirt just published some interesting data about when people shop for t-shirts:
[link to blog article]
Basically most people shop when they wake up. Thought you’d be interested.
Best,
Ben
Data Studio Philosophy:
- Our readers deserve never to be confused
- It’s about the information, not the writing style
- Focus on why someone would want to share this story
- People love data. They love maps. They love charts. They love tables. We give people what they want.
Article Templates:
These are also published here in more detail.
- Geographic Variation: “who clicks on ads”
- Trend related to the news: “trump bump”
- Who does that? “the age people outgrow ikea”
- Secret data about something people care about “cost of being a bridesmaid”
- Data that you have that is valuable to business “does mentioning a famous client in an email convert better”
- Rank stuff: “diverse universities”
- Cost and price of stuff: “which cars have lowest maintenance cost”
Non-obvious Learnings about writing
- People care more about cities than states
- For rankings (geography, colleges) have a cutoff of top 100 cities (based on population) or top-ranked colleges
- It’s about the information, not the process. You only need 1 short paragraph about your methodology, near the beginning.
- The intro is paramount. You have to sell the article. You just have to get people excited. You don’t need to get into an elaborate explanation of who you are or why you’re writing it.
- Don’t try to be funny, try to be clear.
- Keep interpretation to a minimum. After writing a few of these style articles you’ll learn what is a PhD dissertation is and what is a 40-hour piece. Don’t make it a PhD dissertation.
- Never apologize for what you didn’t do. Explain what you did do. Say how novel it is “this is the first time…”
- The conclusion should re-emphasize your main point.
- We don’t care about what other data is out there
Editing
- Is this offensive?
- Can anything be taken out of context
- Typos matter less than misunderstandings/offending in massive distribution. Even offending 1% of people is huge.
- Make it possible for people who are responsible for the blog to succeed
Learnings about visualizing data
- Titles should be clear and enticing. Catchy title: “Ranking the countries that drink the most wine”. Boring subtitle: “Wine consumption in liters per capita in 2011”
- Tables are fine, don’t need to be complicated or interactive. It’s nice have some variation though.
- People love maps! And not because they convey information well.
- Round your numbers sensible. Use commas, have empathy for your readers’ eyes
- 3-5 charts is the maximum before it gets boring
Questions
Should I be worried about other content on my blog? No one cares about you. Don’t worry about your other content or feel obligated to retool, edit or delete it. No one cares.