Boston Bike Crash Map in the News

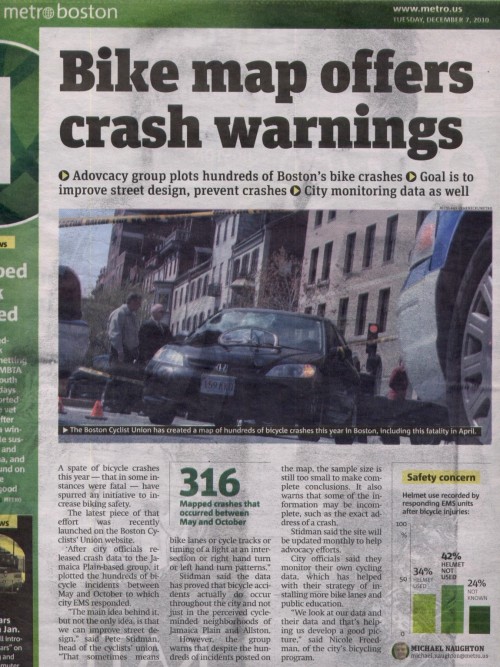
Boston’s Metro newspaper ran a page 2 article on the Boston Bike Crash Map the Boston Cyclists Union and I created. Also in the news:

This is a stunning example of what a non-profit can do with government statistics, Google Maps, and a very dedicated volunteer.

Among other concentrations, it shows a dark line of bruised elbows, broken fenders, and worse stretching from the Back Bay to Allston along Commonwealth Avenue, right past our studios at WBUR.


Proposals to change the tax-deductibility of donations

The New York Times yesterday gave a breakdown of proposals to change how donors calculate donations in their taxes:

All three deficit reduction proposals from the blue ribbon panels would eliminate the deduction in its current form.

One of the panels, the National Commission on Fiscal Responsibility and Reform would give taxpayers a tax credit worth 12 percent of their donations — but only if they contributed 2 percent or more of their adjusted gross income to charity.

Another plan proposed by a panel of three liberal-leaning organizations — Demos, the Economic Policy Institute and the Century Foundation — is similar, suggesting a 25 percent tax credit for all charitable gifts.

The plan philanthropic experts find the most intriguing, however, comes from the Bipartisan Policy Center panel, which suggests borrowing a system of subsidizing nonprofits similar to the one used in Britain, called Gift Aid.

Under that proposal, nonprofits could claim a tax credit worth 15 percent of any charitable gift they received, effectively giving the donor a partial match. For instance, if a donor makes a charitable gift of $100 to a charity, the charity could apply to receive an additional $15 from the government.

I’m partial to this proposal from the Partnership for Philanthropic Planning (via Gift Hub):

For many years, PPP has suggested a conceptual alternative to the charitable deduction. PPP’s plan addresses the current goal of simplifying the tax code, while supporting a robust nonprofit sector that can compensate for reduced government services. Rather than a deduction from income, we propose that charitable contributions be treated as an adjustment from gross income. Since the donor never receives the benefit of income which is contributed to charity, the amount contributed should be considered unavailable for taxation at all. Far from the “tax expenditure” that the [National Commission on Fiscal Responsibility and Reform] suggests, allowing charitable contributions as adjustments to income would provide a fair and accessible incentive for charitable giving to all Americans.

And of course, don’t forget the background context of rising inequity, a lapsed estate tax, and the models of individually-determined giving versus democratically-determined (ostensibly) government grants and earmarks.


Undermining nonprofit significance

From a Facebook comment on Kate Barr’s “ Nonprofits, Social Enterprise, and Hot Buttons” ( blog link):

The craving to undermine nonprofit signficance, value and tax-exemption is endless and will probably never be “satisified” until the entire 501-c section of the tax code is repealed. And there do exist those who want to do exactly that. Those who deeply resent paying taxes at all loathe the nonprofit field for its tax exemption. They won’t stop and they won’t shut up, even when repeatedly, humiliatingly and thoroughly refuted.

This is a perspective I share, though rarely so explicitly.


This is me not being cynical about nonprofit innovation

A comment I made about the newly launched Jumo platform for nonprofits, in response to much bellyaching on Facebook about it being duplicative and pointless:

I don’t get it either. But I’ve been increasingly thinking about a recent David Pogue column ( http://nyti.ms/id0kep) in which he says “Things don’t replace things; they just splinter.”

We have this idea in the nonprofit world that we must overly optimize the resources we have; cleanly transitioning from one model to the next with minimal duplication. That’s not realistic and probably wouldn’t be innovative either. Instead we just have this messy iterative process of broken models, half-starts and ignorant foundation officers—from which the next round of innovators can cobble together an itch-scratcher and pitch it as “Hotness-XYZ but for nonprofits”.

I think Jumo sucks so far, but the few million dollars it took to launch is a drop in the bucket. Unless it causes Omidyar and Knight to pick up their checkbooks and go home, I think it will help move the ball towards something more transformational to the sector.


Public data vs. Self-reporting

A comment by Pete Stidman of the Boston Cyclists Union, in response to a proposal to build a Chicago Bike Crash Map:

I would advise against self reporting—because what you get is only crashes within whatever bike subculture is reached by the map and by the web. Boston did that before our map and the spread of accidents across the city is very different in each—and could give people the wrong ideas about priority streets and areas. (This is particularly true in communities of color, which were heavily under-reported in Boston’s self-reported crash survey.)

Boston’s bike crash map is generated from (somewhat-) public data on on ambulance runs and EMT reports; Portland has a self-reported bike incident map.


Accessible leisure through technology

I always talk about technology as a multiplier of action; here is someone with better credentials than me making the same point: Kentaro Toyama writing in the Boston Review on “ Can Technology End Poverty? [No]

The following excerpt touches upon how technology enables the developing world to experience the same leisure activities the developed world enjoys:

Along with differential access and capacity, a third mechanism—differential motivation—contributes to the widening divergence between the privileged and the marginalized. What do people want to do with the technology they have access to? Those of us who have worked in interventionist ICT4D have often been surprised to find that poor people don’t rush to gain more education, learn about health practices, or upgrade vocational skills. Instead, they seem to use technology primarily for entertainment. Telecenter surveys find that when a village has ready access to a PC—connected to the Internet or otherwise—the dominant use is by young men playing games, watching movies, or consuming adult content. Many become proficient at the software incantations required to download YouTube videos from a PC onto a mobile phone. But these same users typically forsake software-based accounting and language lessons. What interventionists perceive to be “productive” use of technology is trumped by the “frivolous” desires of users. Even users in the developed world rarely take advantage of their technologies for purposes of self-improvement—the most popular iPhone apps are games and other entertainments, nothing that would improve productivity or health—but this tendency is exacerbated among those who have grown up with lessons of learned helplessness and low self-confidence.

I’m not blaming the victim. None of the three mechanisms necessarily speak to failures on the part of those who are poor or poorly educated. Blame, if it must be attributed, falls readily on historical circumstances, social structures, and the rich world’s unwillingness to invest in high-quality, universal education. In fact, one reason for valuing education is that it generates the appetite for and capacity to use modern tools—all the more reason to focus on nurturing human capability, rather than trying to compensate for limited capacity with technology.


Boston Bike Crash Map

Today the Boston Cyclist’s Union (BCU) launched their interactive Boston bike Crash Map, a mapping tool that I’ve been working on with them to help share and analyze bicycle crash data. They did all the hard work of getting the Boston Emergency Medical Services and Police Department to properly code and release the data—I just helped them clean it, geocode it and put it on a map.

It is an exciting project both because the data is compelling for bike safety and livable streets advocacy, and it required some novel/cludgy engineering. We wanted to create a system that would allow the BCU to access and update the data behind the map, but because of their technical capacity, I couldn’t overly format the data or create a CMS database. The solution: Google Spreadsheets. All of the data is stored in a shared Google Spreadsheet that is automatically fed to the map on BCU’s website. Google Spreadsheets can even geocode the addresses. I had to mess about with the javascript code a bit—aggregating multiple overlapping incidents at the same location into a single marker was all me—but overall it was a fun project.

Back in March and April of this year we asked Boston Emergency Medical Services (EMS) and the Boston Police Department (BPD) to separate bike and pedestrian crash data to allow us to see where bike crashes are happening. And to theircredit, each department quickly recognized the need and worked with us to meet it, partly by adding bicycle checkboxes to their incident report forms.

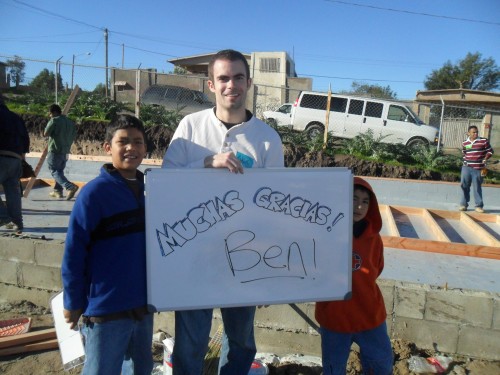
Now, not only do we have over six months of data to look at (May thru October 2010), but  it’s all plugged into an  interactive Google mapcreated by Union member and volunteer Ben Sheldon. Thanks Ben! It will still be a year or two before we can have a large enough sample size to discern reoccurring patterns at particular intersections, but this first six-month glimpse of the data does give a sense of where crashes are happening in the city and a few other interesting things.

**Update: **The map has been mentioned on WBUR and UniversalHub. I’ve been told that after releasing the map, there has been a big uptick in BCU memberships and request for info too.


A difference of a map

From “Assessment Overview of One Laptop per Child Projects”, an evaluation of One Laptop Per Child deployments: “Figure 1 : The current global distribution of XO laptops across the world.”

From the community created and curated http://olpcmap.net :

This second map was launched at OLPC San Francisco Community Summit. Marina Zd collected some good pictures of the other maps being created there:

I was invited to attend the summit because of my experience in organizing community events like the Grassroots Uses of Technology Conference. Bottoms-up, participatory and community-centric planning is not a core competency of OLPC (to put it gently), and I was asked to advise on how to better recognize, support and grow the existing—but poorly-connected—communities that are part of the broader OLPC ecosystem. This meant more prosaic things like making sure every session has a volunteer notetaker, but then that’s the kind of thing that helps build a participatory community. Just look at everyone who has added themselves to the map.

But not to  rip on that report either, since it verifies a lot of anecdotes about the impact of OLPC deployments:

Teachers in Ethiopia praised the ease in which they were able to adapt the XO to their existing curricula and its complimentary nature to their lesson plans. They noted that the introduction of the XO forced them to outline a daily schedule and their class objectives each morning, facilitating more effective planning and a more productive day in school. Teachers in the Solomon Islands repeatedly mention how the XO helps them to record children’s activities, monitor their progress, and track their assignments. In Haiti, most teachers noted in their interviews that it was much easier to edit their students’ work on the XO laptop and as such they were able to spend more time working one-on-one with students and less time lecturing.

….

Increased specialized attention, motivation and enthusiasm for learning, and confidence in children’s futures as a result of skills and knowledge building are huge components in building child confidence and drastically improving attendance, thereby decreasing dropout rates in the long-run, and producing a more well-educated society. Similar overwhelmingly positive statements about child confidence and the feelings of being “special” and worthwhile as a result of the introduction of laptops into the community for the children are found in reports from Alabama in the United States all the way to remote indigenous communities in Western Australia.